Void of Course Moon Tables
March 10, 2016Graphic Ephemeris in Horoscope Reports (MacOS)
May 31, 2016The Graphic Ephemeris can be added to the Mac version of iPhemeris with a one-time In-App Purchase. The Graphic Ephemeris feature adds the following capabilities:
- A new tab on the main view allowing display of planetary longitude and declination.
- A new Graphic Ephemeris Report in the Report section of charts that overlay’s the currently displayed astrological chart data.
The feature will be added in the last tab position but it can be moved anywhere from the Function Toolbar tab of iPhemeris Preferences.

SETTINGS
Settings are accessed from the gear at the top left of the Graphic Ephemeris View. The settings are only for the Graphic Ephemeris Tab and allow setting:
- The Color Scheme
- The data type to display graphically: Tropical, Sidereal, Topocentric or Heliocentric.
LONGITUDE
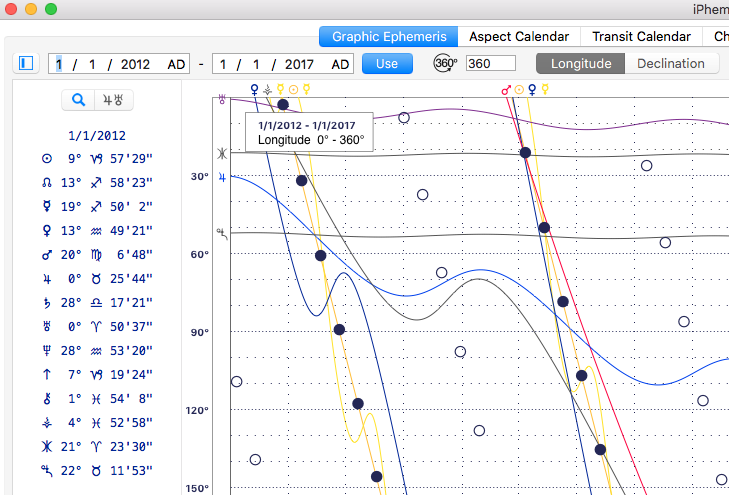
When longitude is selected, standard zodiacal positions for bodies selected in the disclosure panel on the left are drawn for the time period set in the start and end date fields in the tool bar above the graph.
UNDERSTANDING THE DISPLAY
If you are not familiar with the display of a graphical ephemeris, it might help to understand for example, that bodies are in Aries when shown on the graph between 0° and 30° and they are in Pisces when between 330° and 360°.
Planets are conjunct where lines cross and they are in aspect to each other when they are separated vertically by the degrees of that particular aspect. For example, if the Sun is on the horizontal line labeled 30° (Aries/Taurus cusp) and Venus is on the horizontal line labeled 90° (Gemini/Cancer cusp) they are separated by 60° and are sextile on that date.
When Moon Phase is selected in the planet selector, New and Full Moon are displayed. New moon is shown where sun and moon lines cross and full moon where they are 180° apart.
VIEWING POSITIONS
To see standard Astrological notation for any body currently displayed on the graph:
- Open the sidebar at the left (square button in upper left corner of Graphic Ephemeris view).
- Click select the magnifying glass button on the panel (if not already blue).
- Click the mouse anywhere on the graph and the astrological positions for the date wherever the mouse is moved are displayed.
HARMONIC RANGES
Using the harmonic range selector to the right of the Use button, it is possible to look for aspects by folding the graph over on itself for the selected range. If you are not familiar with how this works, best to leave it set at 360°.
For example, if a range of 90 is set then the vertical scale is restricted to a range of 90° and things at 0°, 90°, 180° and 270° are all displayed at the 0° position and appear to be conjunct. This makes it easy to spot angles for the selected harmonic.
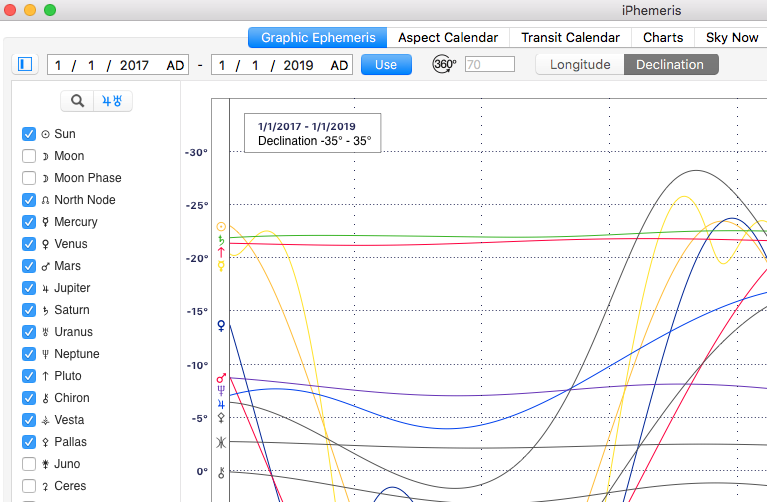
Harmonic ranges can only be used on the longitude display and are disabled when showing declination.
VIEWING DECLINATION

When the Declination button is selected in the toolbar at the top of the Graphic Ephemeris window declination of any planet or body selected in the sidebar is shown. Declination for most bodies is between -30° (south) and 30° (north) degrees of latitude.
Use of harmonic ranges does not make sense for declination and therefore the range selector is disabled.